
Why The Real Capitulation May Still Be Ahead.
Why Late Buyers Are Returning, What Top Cohorts Signal, and How to Size Calmly.
The best way to support me is to share this newsletter. Thank you!
Hey Friend!
Three months ago BTC traded at $63K and nobody wanted to touch it.
Today it’s at $80K and the same buyers are climbing over each other in FOMO to get in.
That’s a pattern that we already saw twice before in bear markets.
A fellow crypto analyst who works at a crypto exchange wrote this week that his phone went silent in February. Cheapest BTC in eighteen months. Nothing. Then May arrived, price was 30% higher, and the accounts that wouldn’t return his calls at the lows started funding again.
Same thing on my end. The consulting inquiries that went basially to zero in February are landing in my inbox now, at higher prices, with more conviction, asking the same questions they were too nervous to ask three months ago.
Let’s be honest. Most people don’t buy with the head. They buy when it feels safe to. Which is almost always the wrong moment.
Let’s get into the broader picture and how to set up for the coming weeks:
️ ⚡ On today's Episode:
📈 Market Update – BTC ripped from $62.8K to $81.4K, but the move looks eerily similar to prior bear-market rallies: fast bounce, late FOMO, weak structure underneath. The $85K and $95K levels now decide whether this is recovery or another trap.
🐂 Alpha Insights – The edge isn’t predicting whether BTC breaks higher. It’s writing rules before emotion hits: What to do at $85K, $95K, and $60K. Plus, a tactical oil grid-bot framework for harvesting volatility inside a stressed $75–$135 range.

Market Insights
This fast bear market rally which we saw just after a big drawdown ($124k to $62k), has shown up in every prior bear market.
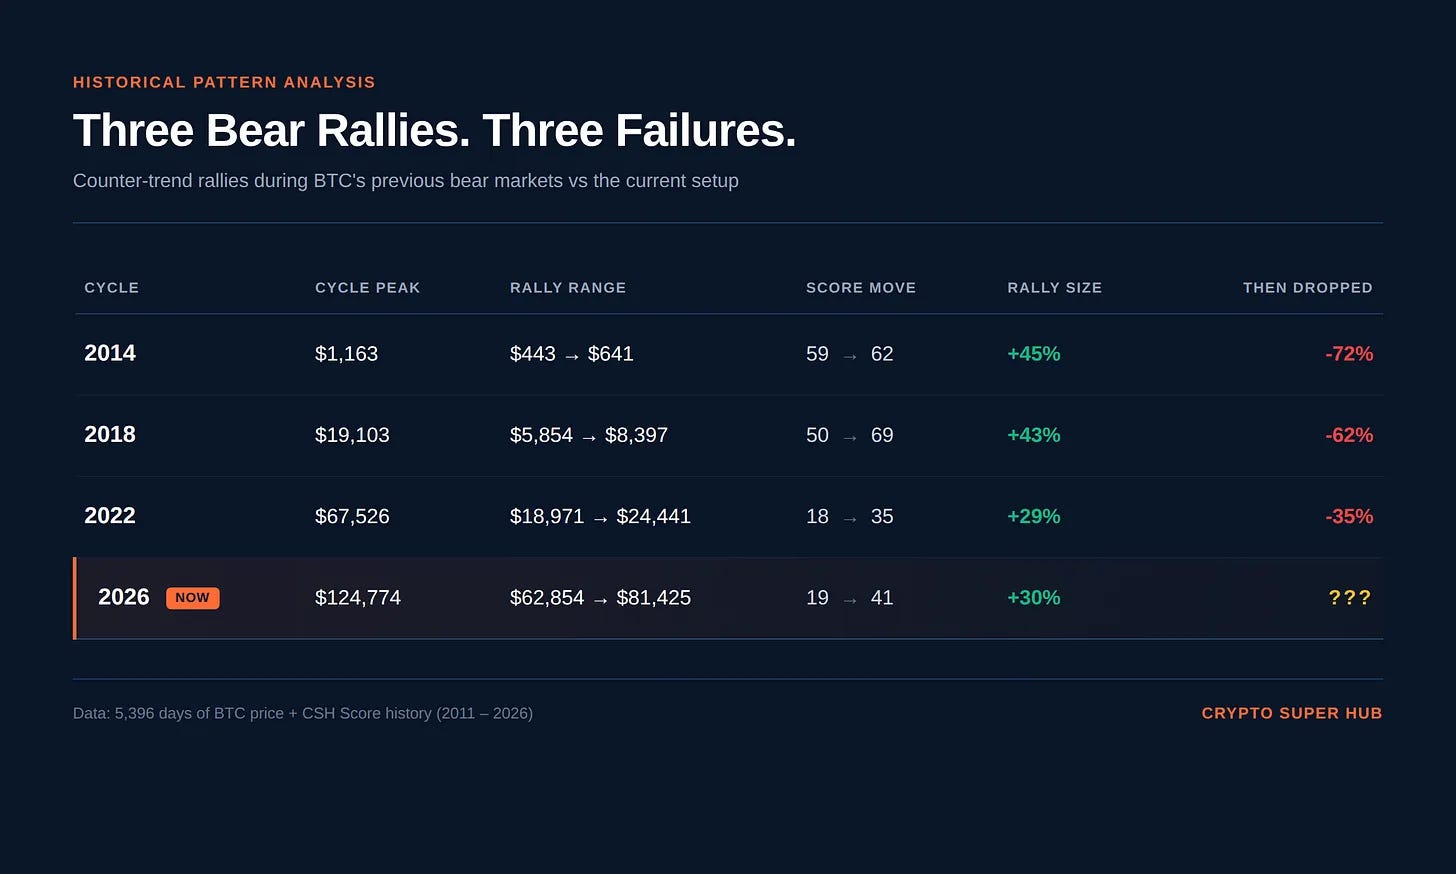
2018: BTC bottomed at $5,854 in June. Rallied 43% to $8,397 by late July. Then dropped 62% to $3,212 by December.
2022: BTC bottomed at $19K in June. Rallied 29% to $24K by August. Then FTX collapsed and price hit $15.7K. Actual bottom came in November.
2026: BTC bottomed at $62,854 in February. Rally peak so far: Around $82k.
Under the surface it gets worse
The price action looks stronger than the market structure underneath it.
The key cohort to watch is the 2025 buyer cohort who bought BTC between $92K and $108K.
So far, that group has only reduced its holdings by 10%.
That matters because the equivalent 2021 buyer cohort — buyers between $47K and $56K — eventually reduced its holdings by 50.5% from peak to trough.
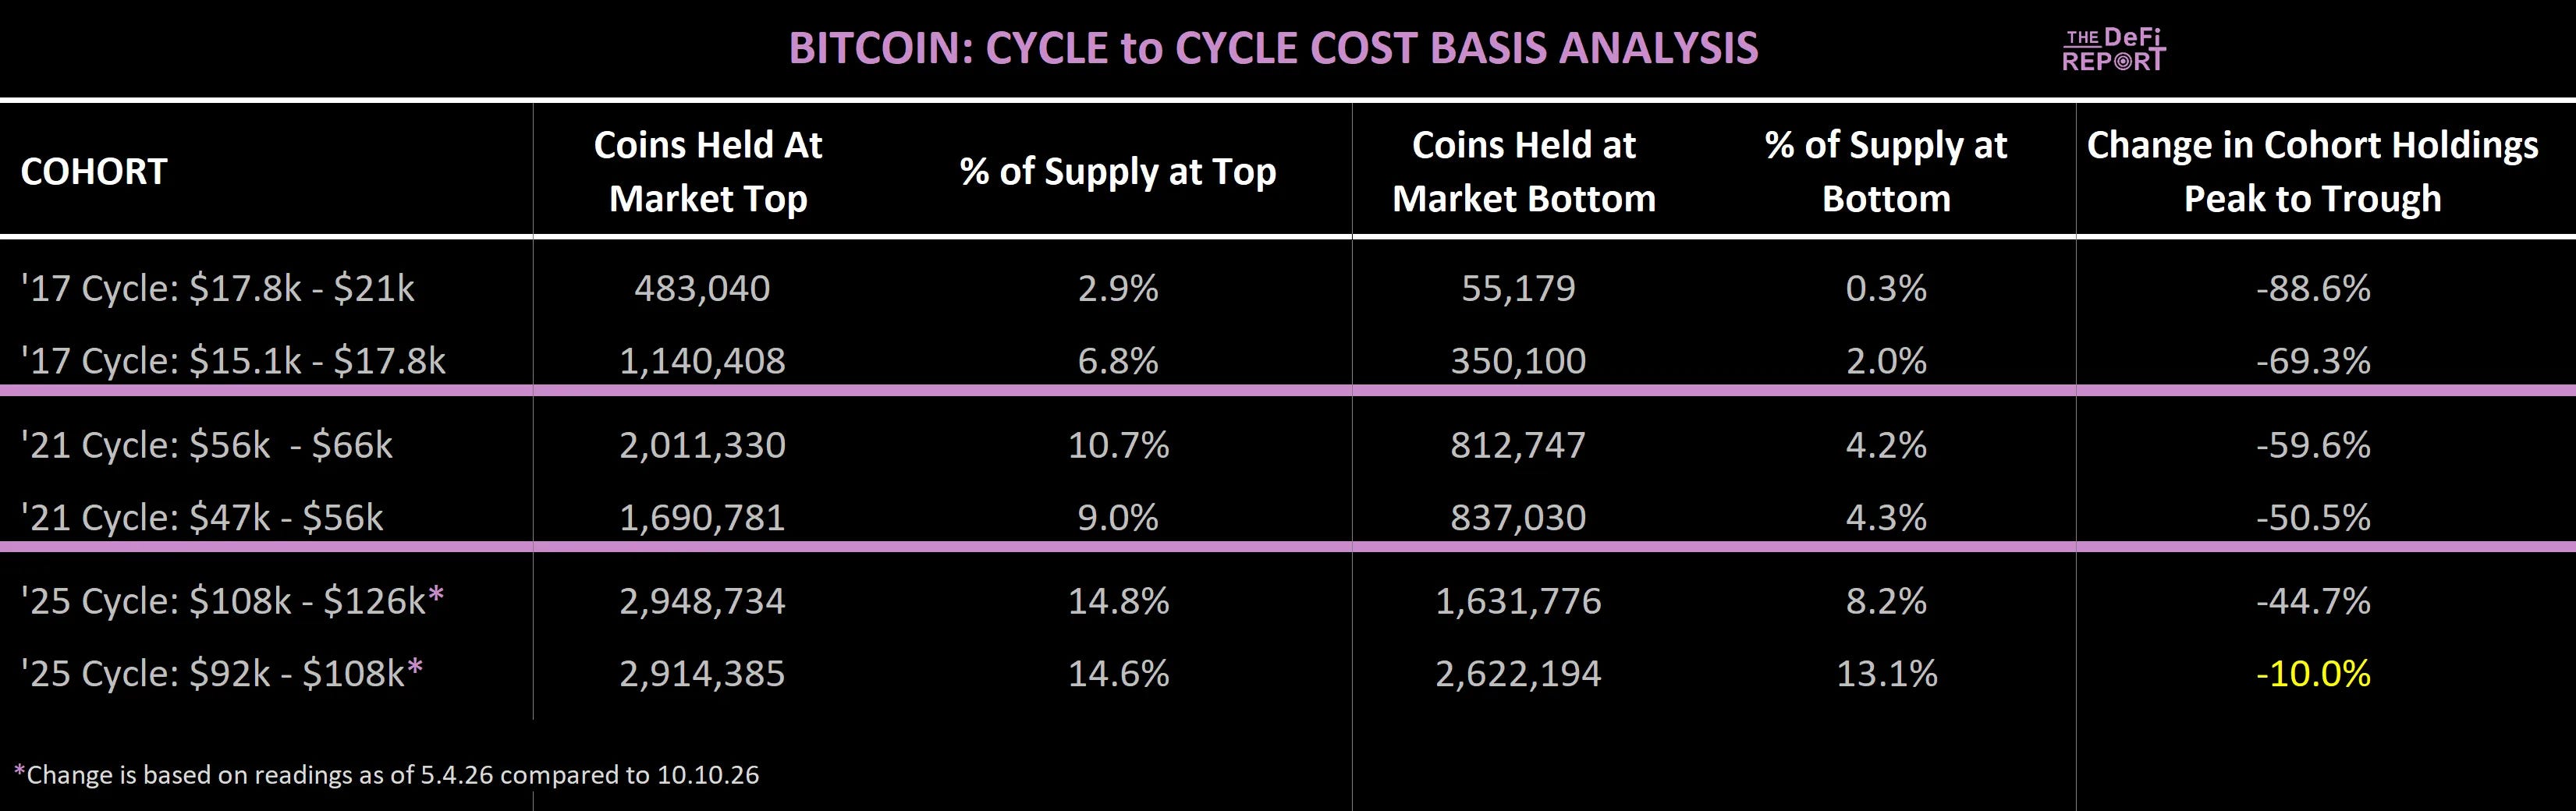
That is the point of the chart:
Many buyers have only trimmed.
Last cycle’s buyers were eventually forced to cut much deeper before the market fully reset.
So if this cycle rhymes, the big capitulation may still be ahead.
And there’s three levels worth watching.
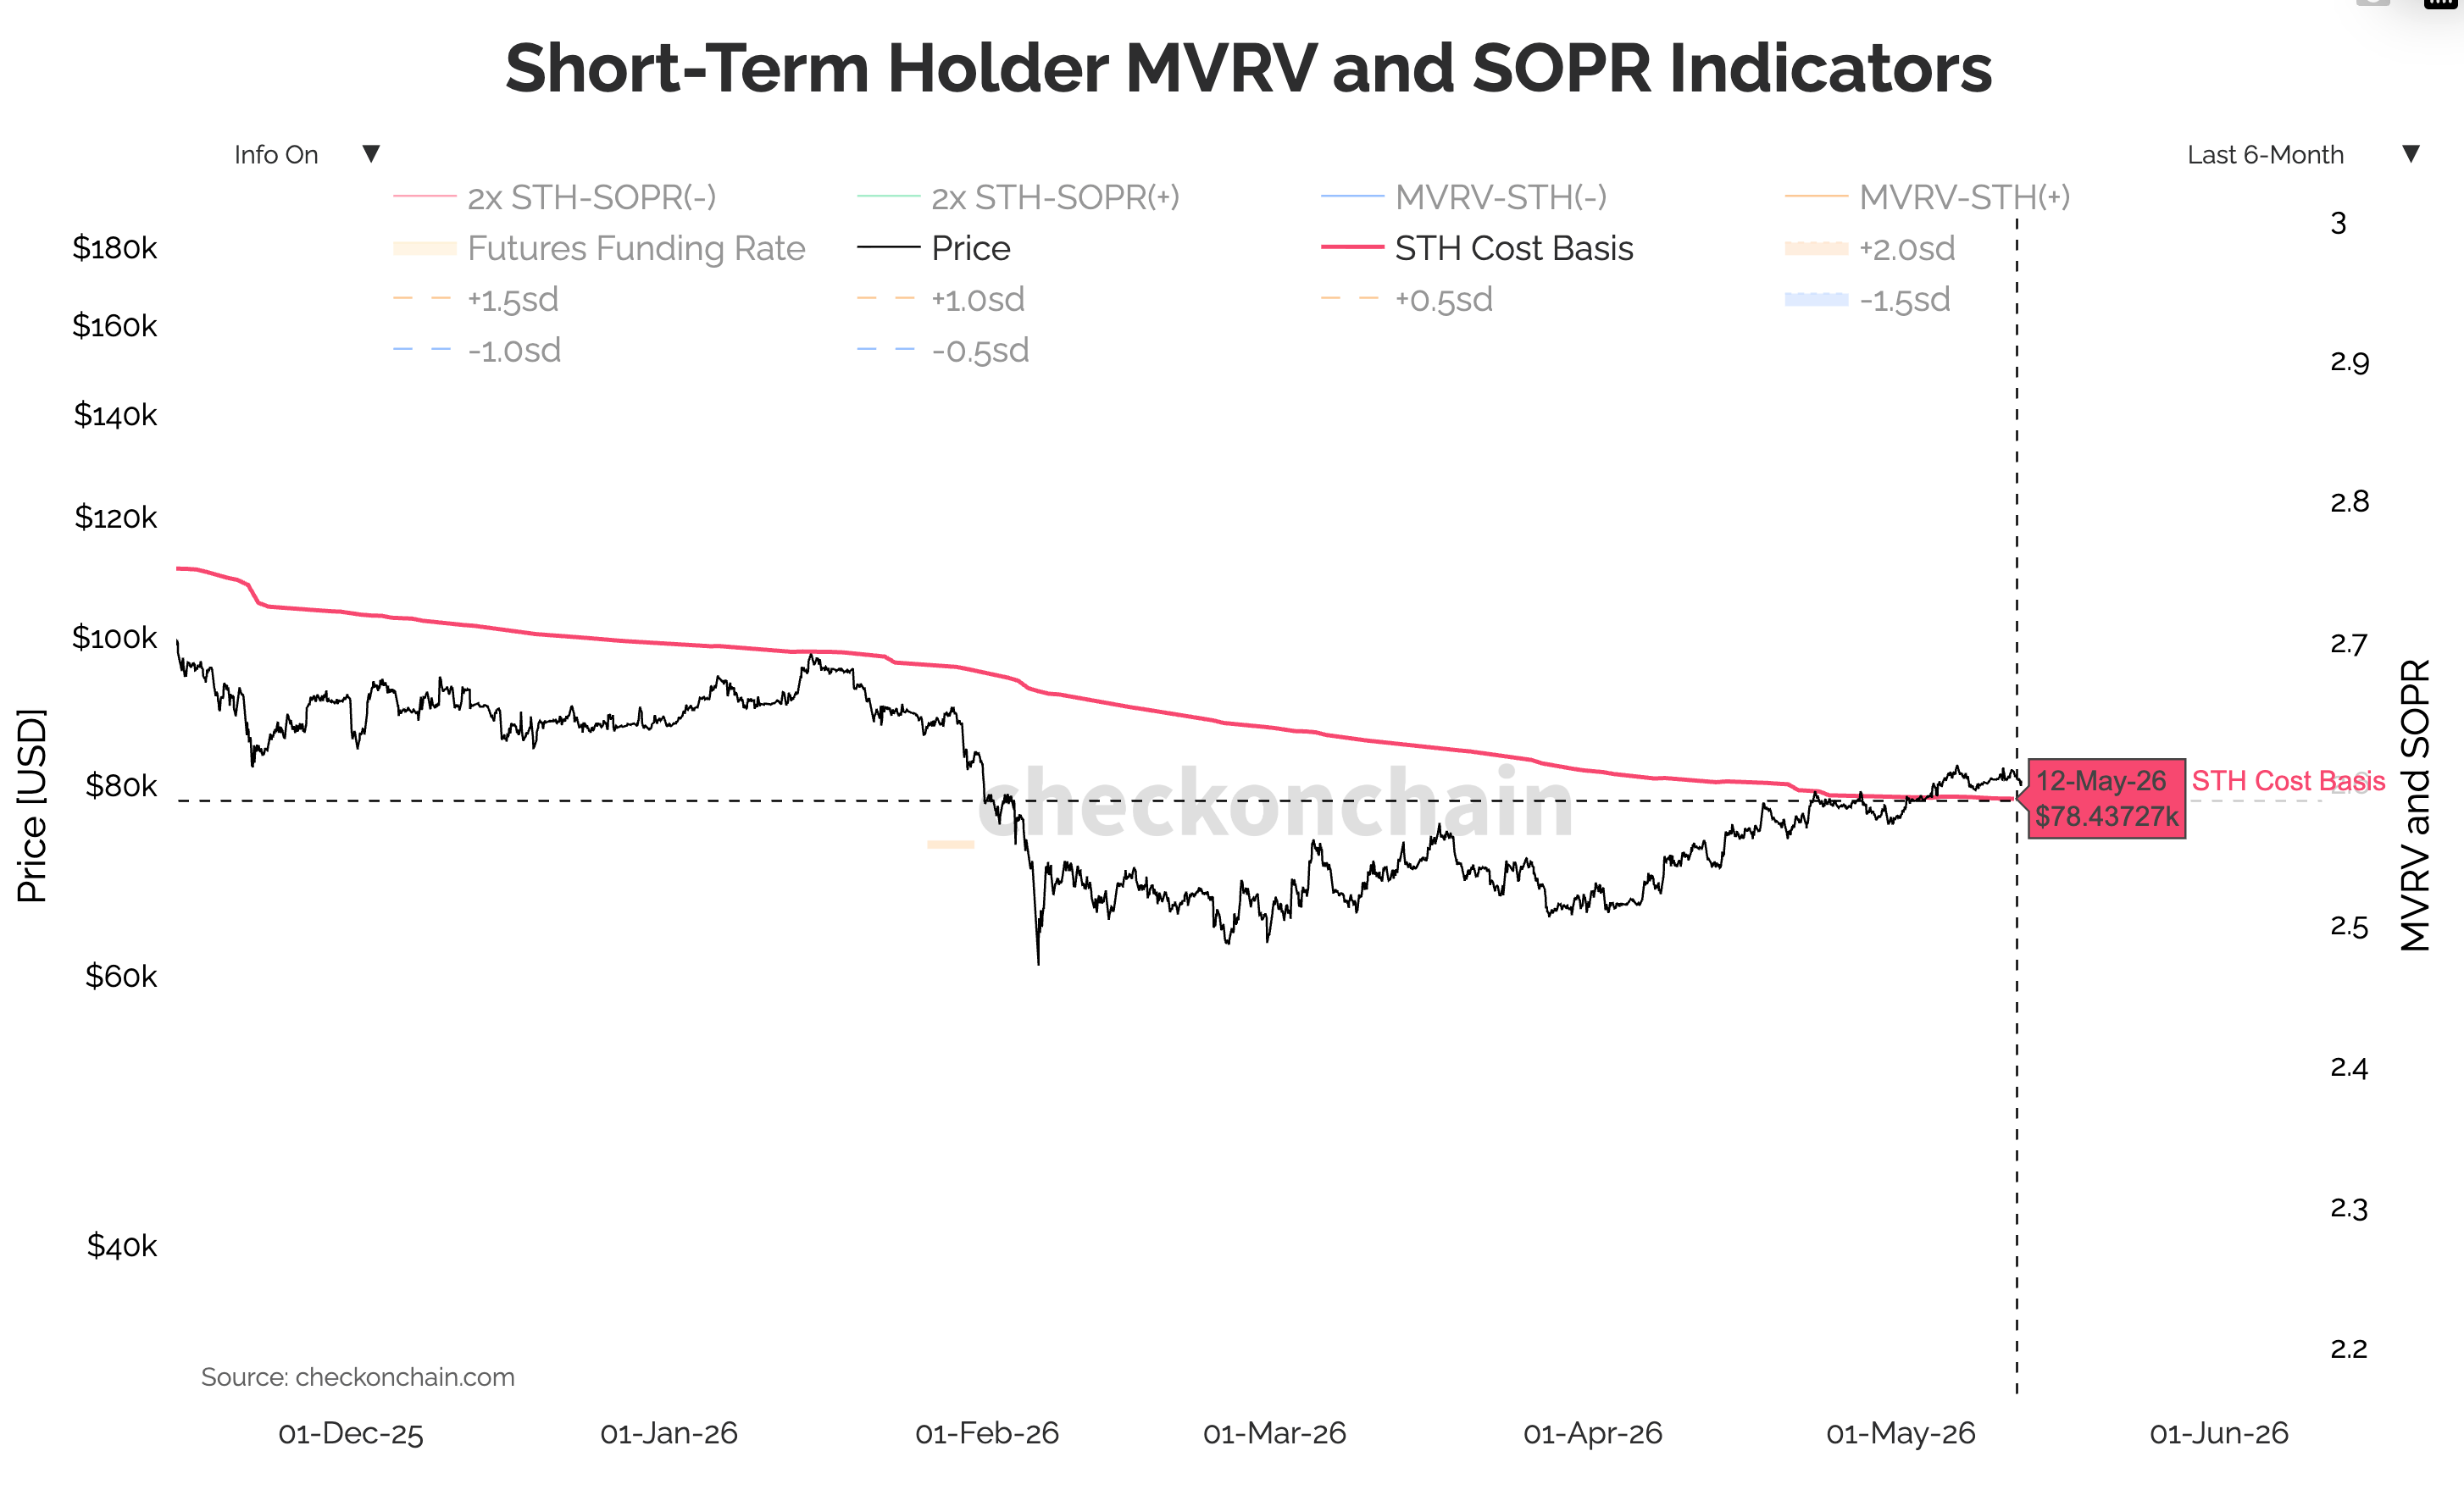
$78K is where short-term holder cost basis is.
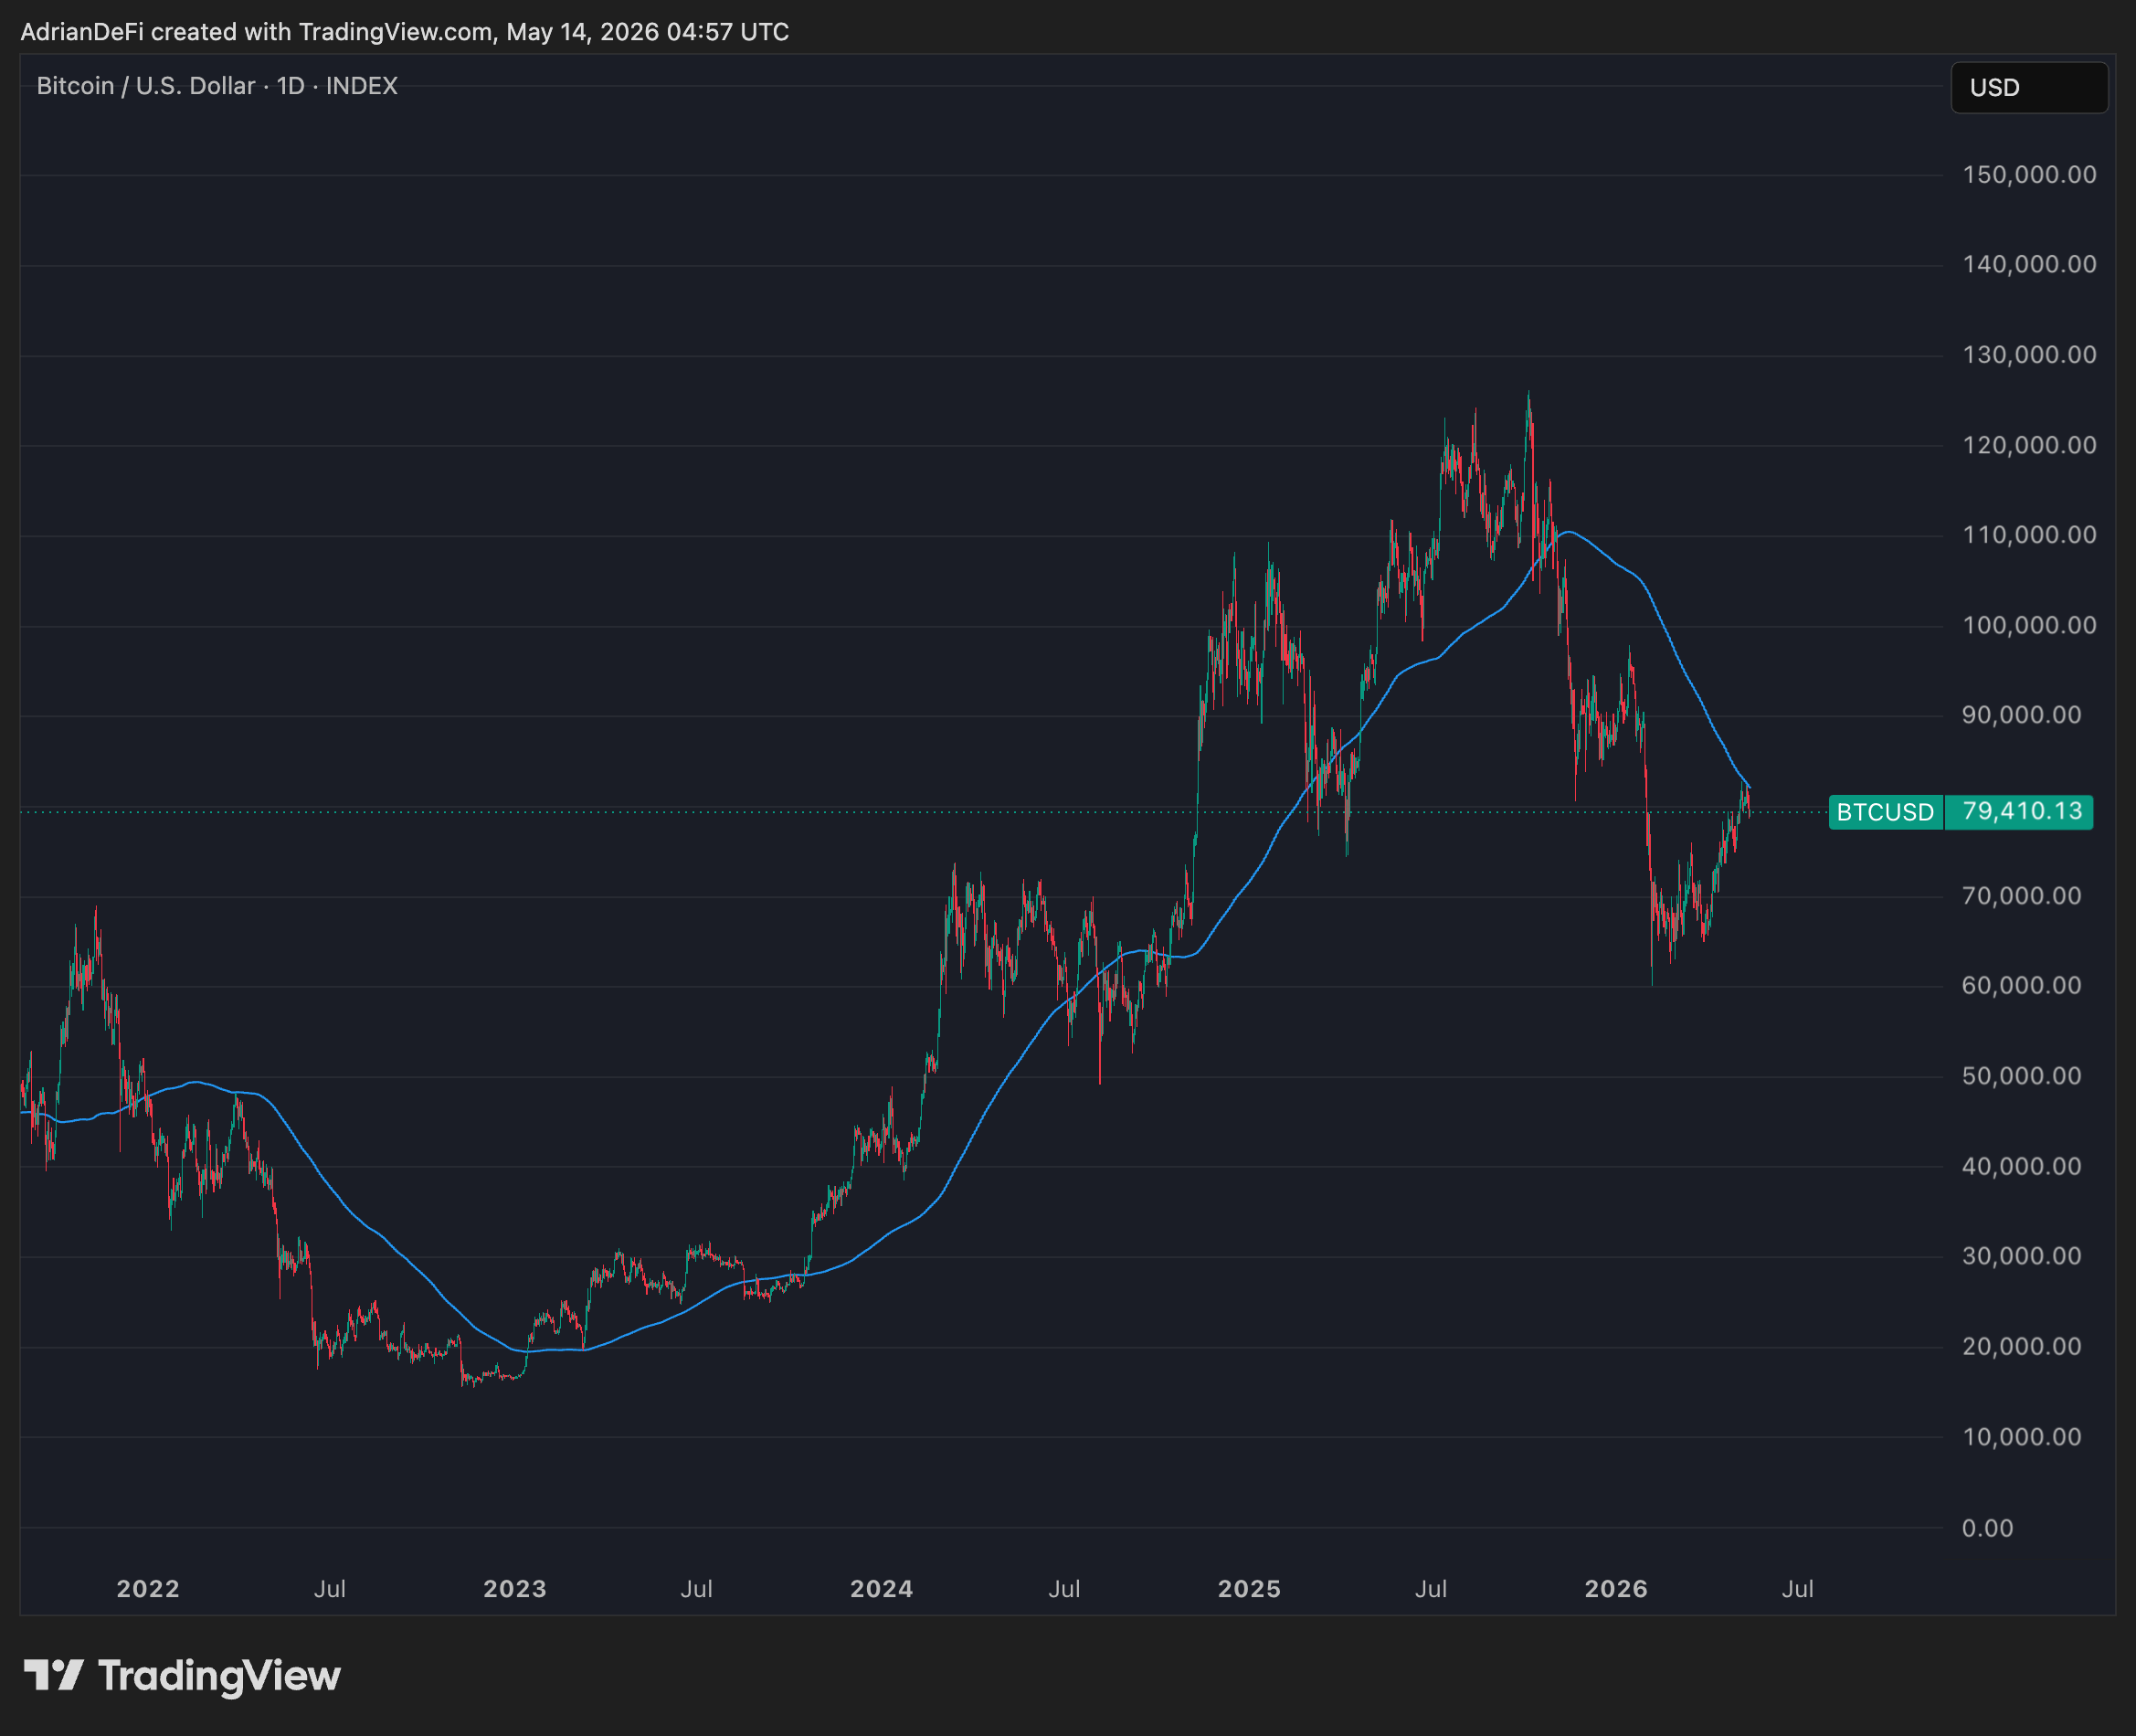
$82K is the 200-day moving average which serves as a long-term trend indicator, often signaling bull markets above it and bear markets below.
Historically: BTC has respected this level during major cycles (e.g., holding above in 2021 bull run, breaking below in 2022 bear market).
and at $85K there is the largest cluster of recent dip buyers. $95K is the 50-week moving average. A bull market would need to retake it.
Until BTC closes above $95K with conviction, the bear-rally thesis stays alive.
The actual question now
Forget asking whether the rally is real.
You can’t answer it. I can’t answer it. The traders on X who say they can are guessing or lying.
The real question: What rules are you using to size into it?
You don’t need to predict the rally. You need to decide, in writing, before the next move, what you do at $82K, $85K, at $95K, and if we revisit $60K.
That decision, made in calm and not panic, is the entire game and will decide long term investment success or failure.
What i’m doing
Not adding here. Not selling either. The position from the lows is doing the work.
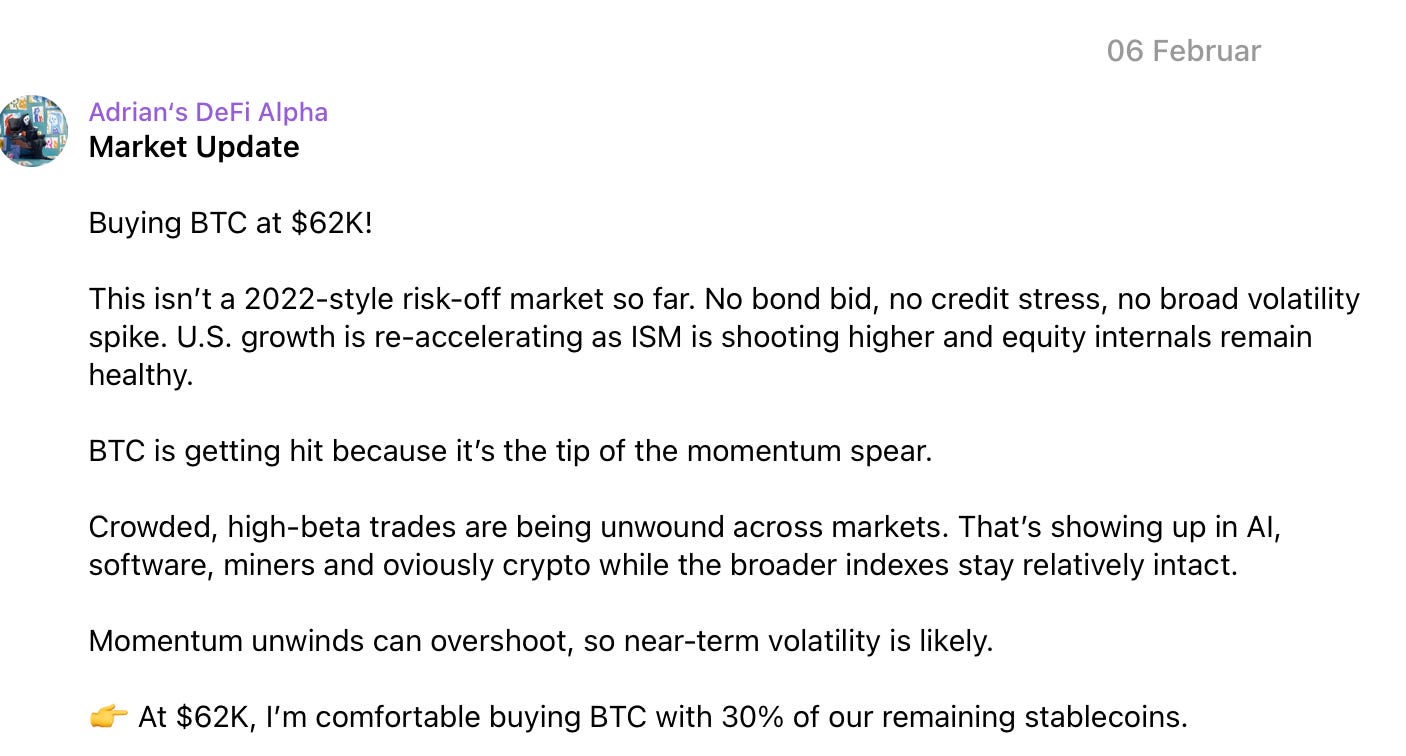
What I’m doing is what my clients hire me for: Writing down the rules now, while the market is boring, so nobody has to invent them at $90K or $55K with panic or FOMO.
If the pull to “finally get in at $80K” is what you’re feeling, that pull is the data point. Sit with it. Then decide whether you want a framework before you act, or after the lesson.
The framework is cheaper than the lesson. A lot cheaper.

Good opportunities I discovered.
Alpha: Oil Grid Bot
Oil isn’t a clean directional trade right now.
Short-term de-escalation headlines like peace talks, reopened shipping routes, reserve releases will push price down fast.
Underlying physical tightness like falling inventories, limited spare export capacity, supply disruption risk will pull it back up.
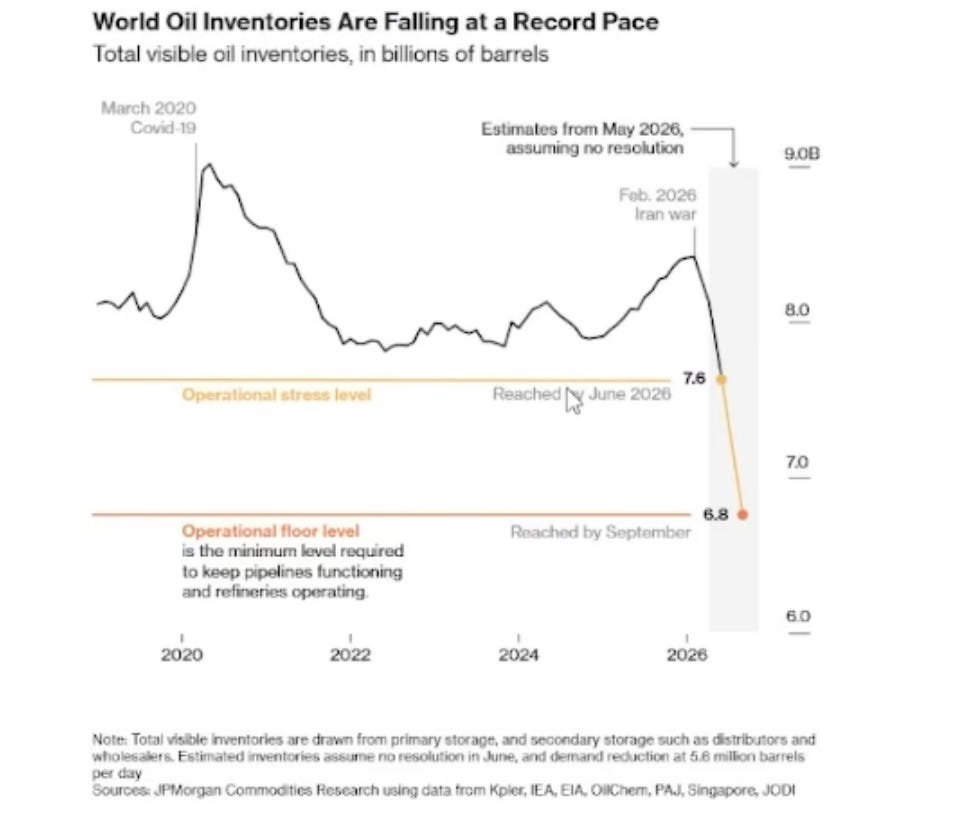
That’s a market that may swing violently inside a wide range rather than break cleanly in one direction.
A good opportunity for me to trade this volatility with a Grid Trading bot.
The range
Lower bound around $75. Roughly fair value if the geopolitical risk premium fully evaporates.
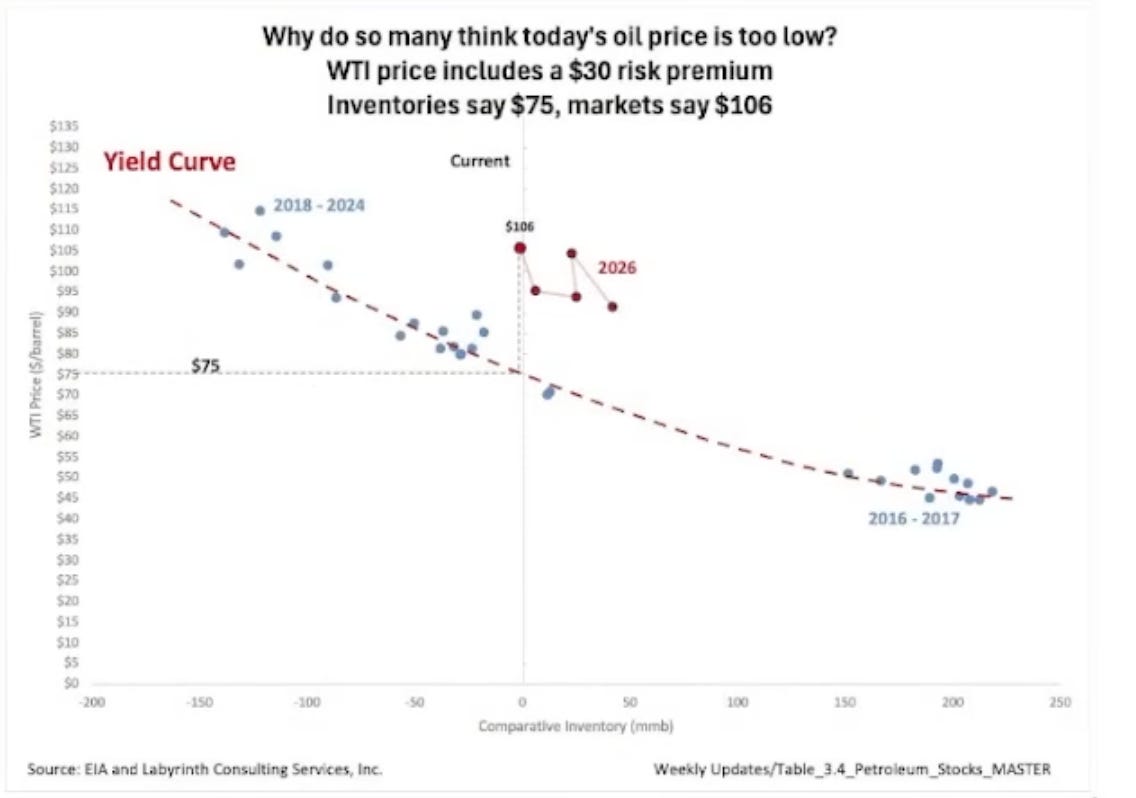
Historically, today’s US inventory levels would imply a “fair” WTI price of around 75 USD.
But WTI is trading near 106 USD.
→ That 30 USD gap is the market’s risk premium for Hormuz, Iran, and escalation tail risk.
Upper bound around $135. The stress zone where demand starts to break because oil is too expensive for consumers and businesses to absorb.
The thesis: Oil stays structurally supported, but the path stays messy.
Why a Grid bot instead of a long
A simple long wins bigger if oil rips straight to $130+. It also bleeds on every headline-driven drawdown along the way.
A grid bot places staggered buy and sell orders inside the range. Price drops, the bot accumulates. Price rises, the bot scales out. You’re not catching the full move. You’re harvesting the volatility around it.
In a two-force market, that structure earns more than directional guessing. If the thesis holds.
The setup
Wide range, long bias. Roughly $75 to $135. Grid spacing around 0.15% per level. Liquidation price safely below the lower bound. Margin buffer that survives a probe to the lower band before any recovery.
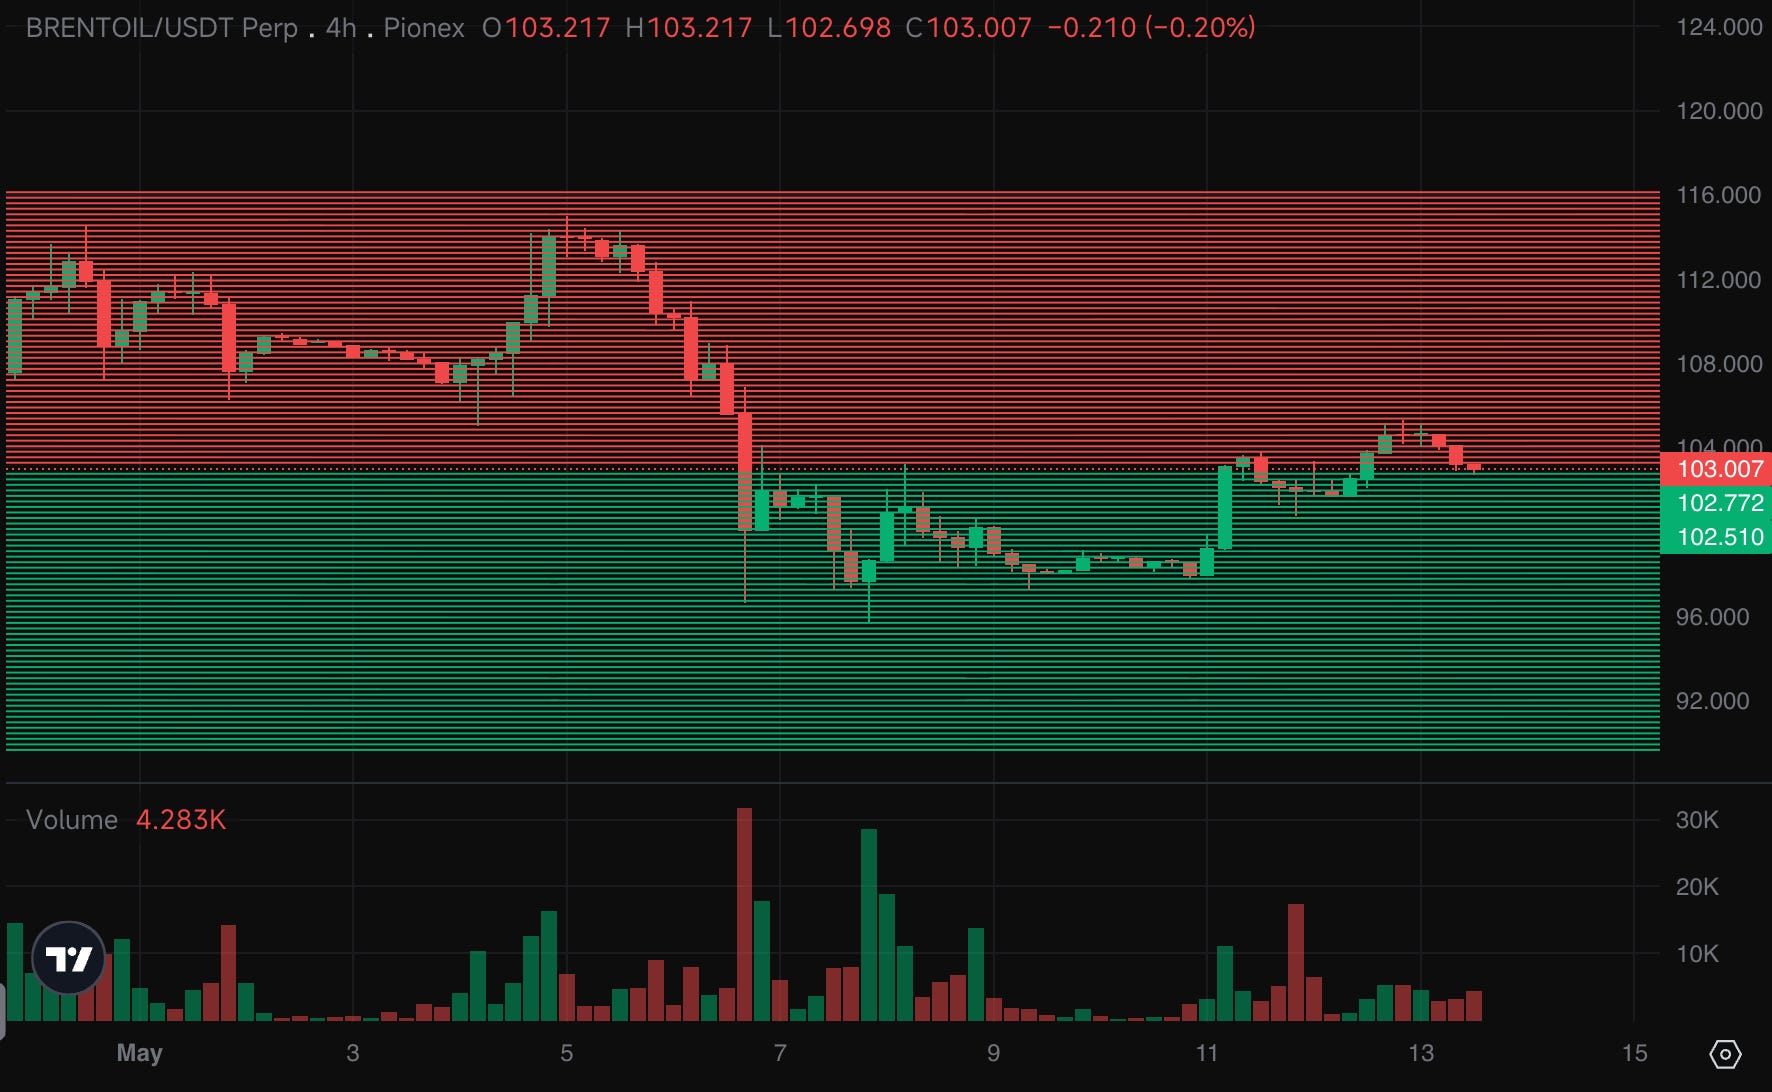
The logic is that the bot has to survive a move toward the lower thesis level and still be live to participate in the rebound.
Where this breaks
A grid is a structure for harvesting volatility. It doesn’t remove risk. It changes the shape of it.
The setup fails if:
The conflict fully de-escalates
Supply routes normalize faster than expected
Inventories rebuild and the floor moves lower
Leverage is too high
Liquidation price sits inside the grid
The biggest mistake people make with grid bots is treating them like insurance. They aren’t.
Background
The trade rewards volatility inside a stressed range. A directional “oil must go higher” bet is a different setup with a different risk profile.
The bet: Headlines push oil down temporarily while fundamentals pull it back up. If that thesis holds, the grid earns more than chasing every move. If oil cleanly breaks $75, the structure fails and you take the loss.
Choose the range according to your own insights. Leave breathing room on the liquidation.
Treat this as a framework for thinking about a trade structure.
I set this up on Pionex, but do your own research and stay safe!
Alpha from Hix0n:
If you want a straight to the point newsletter full of calls, new projects, airdrop farms, memecoin and DeFi moonshots, then Hix0n’s Confidential is the place for you. I can really recommend his take (if you’re comfortable with high risk).

That’s it for today’s episode, thank you for being here!
Till next time, stay safe!